Introduction
In the manufacturing of solid dose formulations, crystallization is a commonly used process. A well designed and controlled crystallization process can be used to substantially improve the economical and biological performance of a drug molecule through exerting control over particle size distribution and morphology, polymorphic form, and purity. However, crystallization can be difficult to control due to the complex relationship between thermodynamic and kinetic factors and processes such as nucleation, growth and agglomeration. Therefore, in order to maximize the benefits of crystallization, a thorough understanding is required which can be done though modeling, design of experiment stress testing and the use of process analytical technologies (PAT).
The invention of process analytical techniques (PAT) has allowed for the real time in-situ monitoring of various parameters, including concentration (FT-IR, UV-Vis), cord length (FBRM), morphology (particle viewer) and solid form (Raman)
Molecular materials and each phase/polymorph of those materials produce unique Raman spectra. The typical Raman spectrum consists of sharp well-resolved peaks, whose intensity is dependent on concentration. Crystalline with Raman integration can provide compositional information about the content of the reaction vessel. Raman spectroscopy is a type of vibrational spectroscopy, producing similar information as FTIR (Fourier transform infrared spectroscopy). Raman however is well suited to monitor the solid phase in slurries, including those containing water. While FTIR is essentially blinded by water’s strong IR absorption, water produces only a weak Raman signal.
Raman spectroscopy may resolve the smallest differences in energies of the crystal lattice vibrational modes, which are affected by changes in molecular interactions arising from different unit cell structures or configurations of the molecules, or formula units within the unit cell, hence indication of polymorphism.
The Raman spectra of crystals with small differences in bond lengths or crystal spacing will also manifest small differences in the Raman peak positions.
Boehringer Ingelheim case study
An active ingredient under investigation has two known anhydrous forms, hereunder designated as Form I and Form II. Thermal analysis showed a melt recrystallization of Form II into Form I. Preliminary experiments showed that Form II is the more stable form at room temperature with the two forms showing an enantiotropic relationship. The transition temperature was now determined at BI laboratories to be around 70°-75°C through bracketing experiments with slurry of both forms at different temperatures, using Crystal16 and Crystalline instruments.
Real time Raman
In order to better understand the crystallization and the stability of these two forms, suspensions of each form were measured by using the Crystalline instrument coupled with Raman spectroscopy. After comparison of the two spectra, the peaks of interest were selected as the amide III bands. A given amount of the metastable form (Form I) was suspended in a saturated solution of the compound and 10% of the stable form (Form II) was added at 60 and 20 °C.
The kinetic transformations were observed at different temperatures as follows:
• At 60°C (graphs below) a full conversion to the stable form was observed after 200 minutes
• At 20°C, 600 minutes were required to achieve the same result
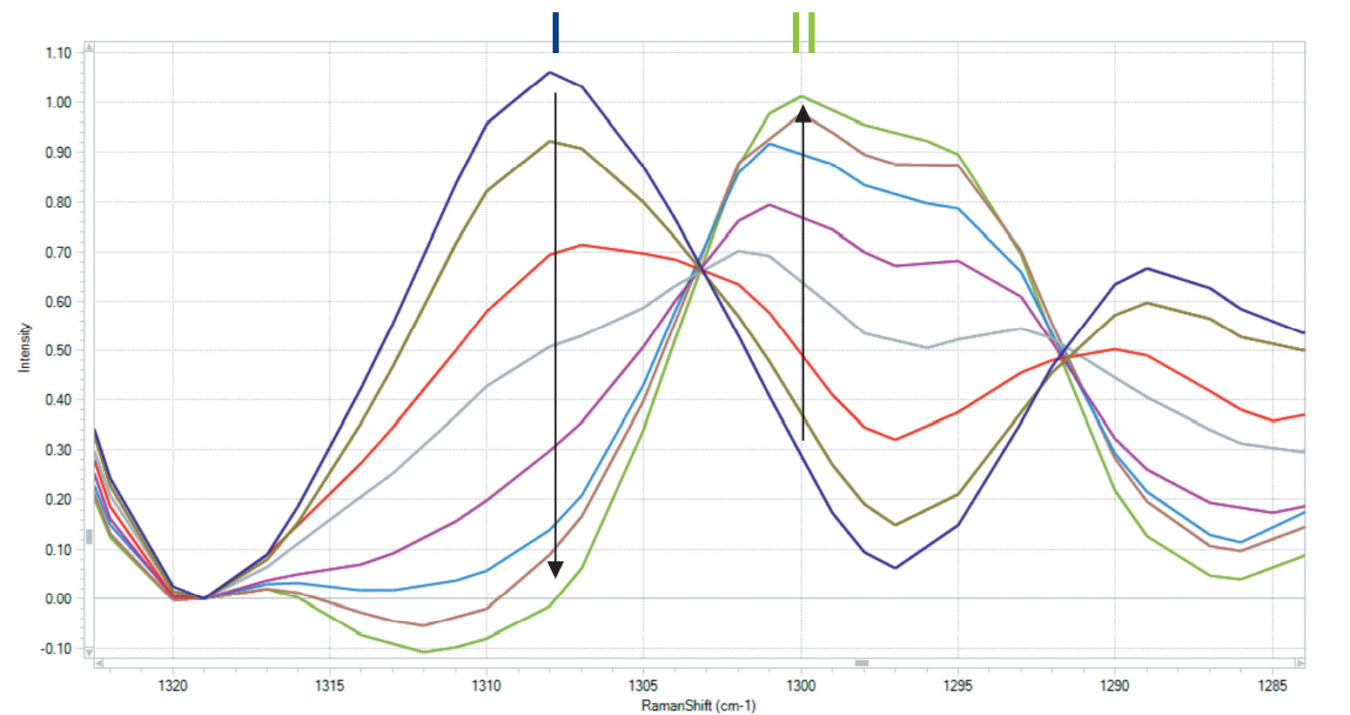
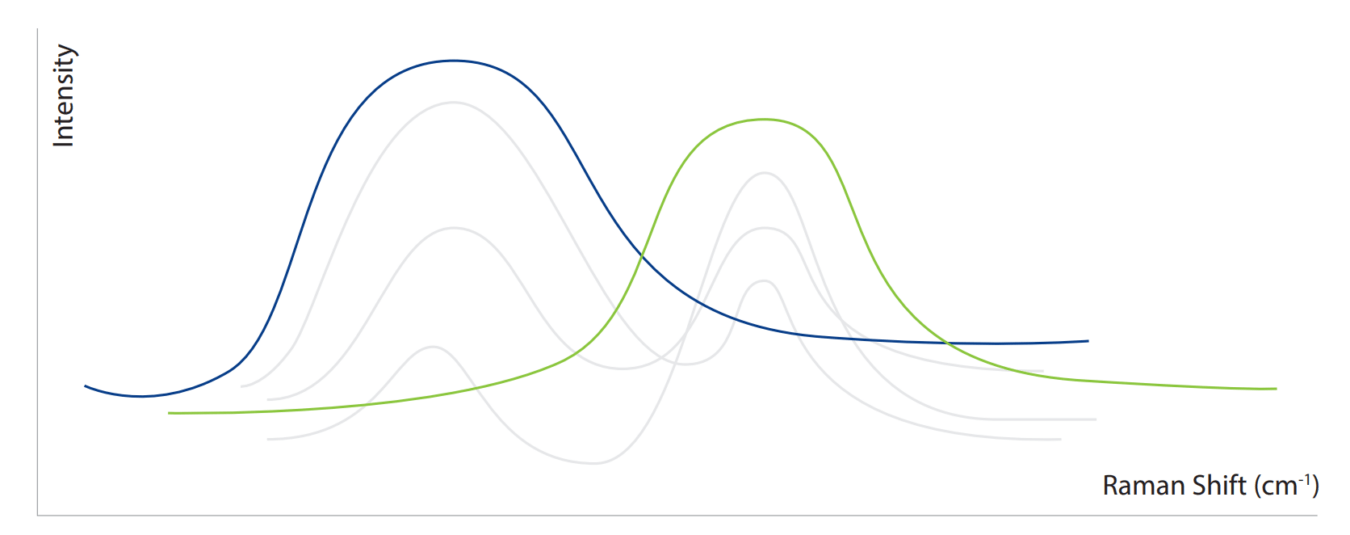
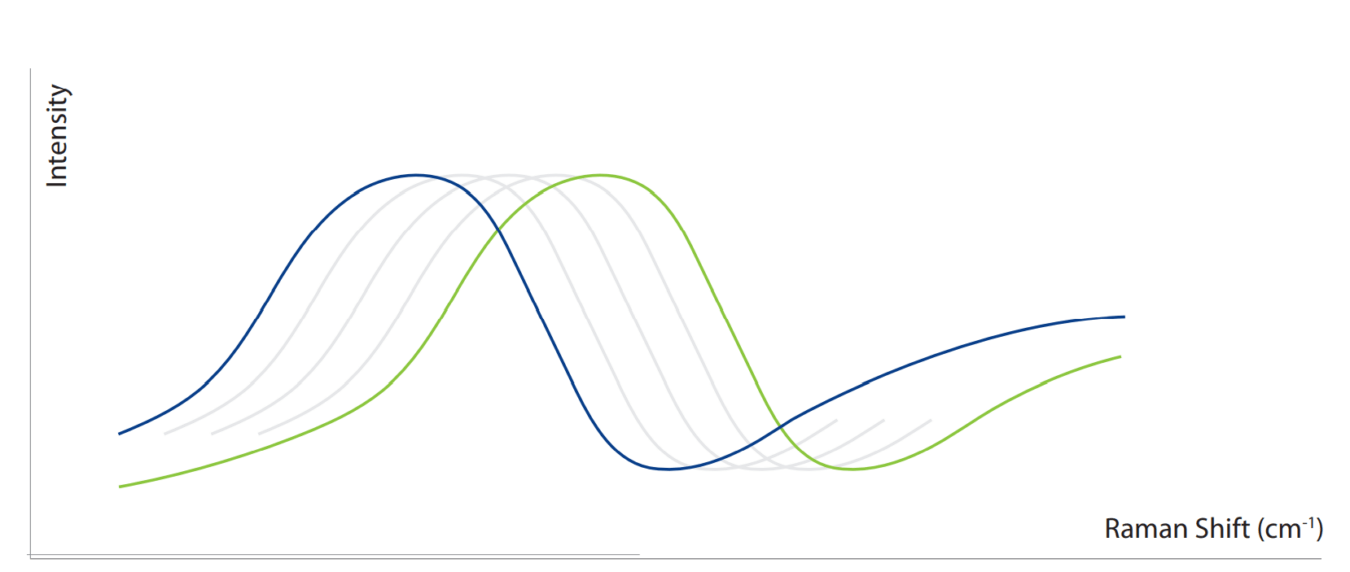
Figure 1: Raman Change from Form I to Form II
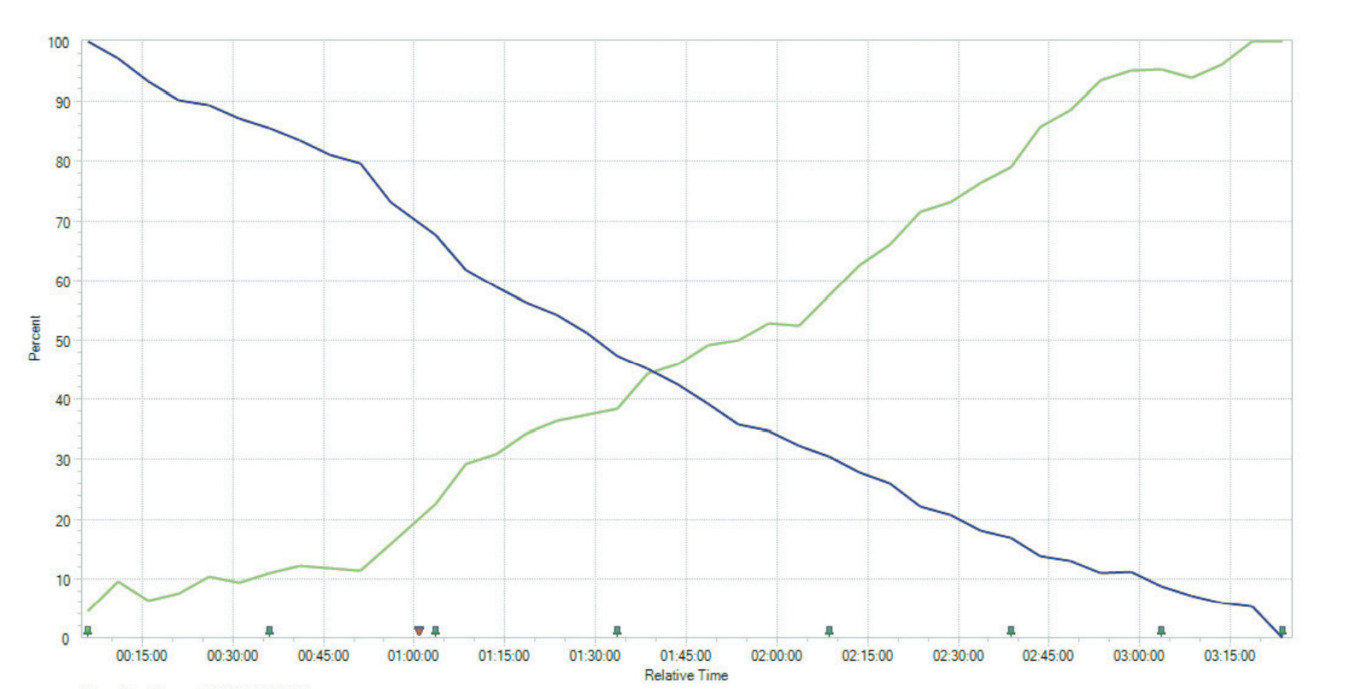
Figure 2: Indicating transformation from Form I (blue spectrum) to Form II (yellow spectrum).
Real Time Raman during Crystallization Experiments
The Crystalline gives the user access to real time Raman spectroscopy, in combination with a sophisticated parallel crystallizer with turbidity measurement. The independent Raman probes are integrated in an ergonomically designed, pre-aligned, robust and sealed module. The user does not have to insert any probes into the reaction vessel. No cleaning of the analytics! No inconsistency in your data! No cross contamination!
Curious to learn more?
Read the full scale experiment in the application note "Crystallization Monitoring with Raman Spectroscopy"